 作者投稿
作者投稿 专家审稿
专家审稿 编辑办公
编辑办公

Research on Chi-Square Statistics in Data Analysis of Inter-laboratory Comparison
-
摘要: 卡方统计量是实验室比对数据处理的关键统计分析工具,可用于比对数据的一致性核验和参考值不确定度的估计。本研究在比对量具有相同期望及比对数据服从正态分布的条件下,提出了一种包含一般线性估计的卡方统计量,研究了该统计量的性质及分布。该统计量可以实现一般线性参考值估计的一致性检验和不确定度估计,为更广泛的线性参考值估计提供统计工具,可用于比对数据分析或多实验室定值测量。作为示例,针对算术平均值使用传统卡方检验需基于各实验室宣称相同不确定度的局限,对任意不确定度组合下的算术平均值给出卡方统计量,为这种常用线性参考值估计的扩展应用提供了新统计分析方法。Abstract: The chi-square statistics, which can be used in the consistency test of comparison results and the estimation of reference value uncertainty, is a key statistical tool in data analysis of inter-laboratory comparison. In this study, under the condition that the comparison results obey Gaussian distribution with a common mean, a chi-square statistic containing generalized linear estimation is proposed, and the properties and distribution of the statistic are investigated. The statistic enables consistency testing and uncertainty estimation of general linear reference value estimates, and provides a statistical tool for a wider range of linear reference value estimates, which can be used for comparison data analysis or multi-laboratory fixed value measurements. As an example, against the limitation of using the traditional chi-square test for the arithmetic means based on the same uncertainty claimed by each laboratory, this method gives the chi-square statistic for the arithmetic mean under any combination of uncertainties, providing a new statistical analysis method for the extended application of this common linear reference value estimation.
-
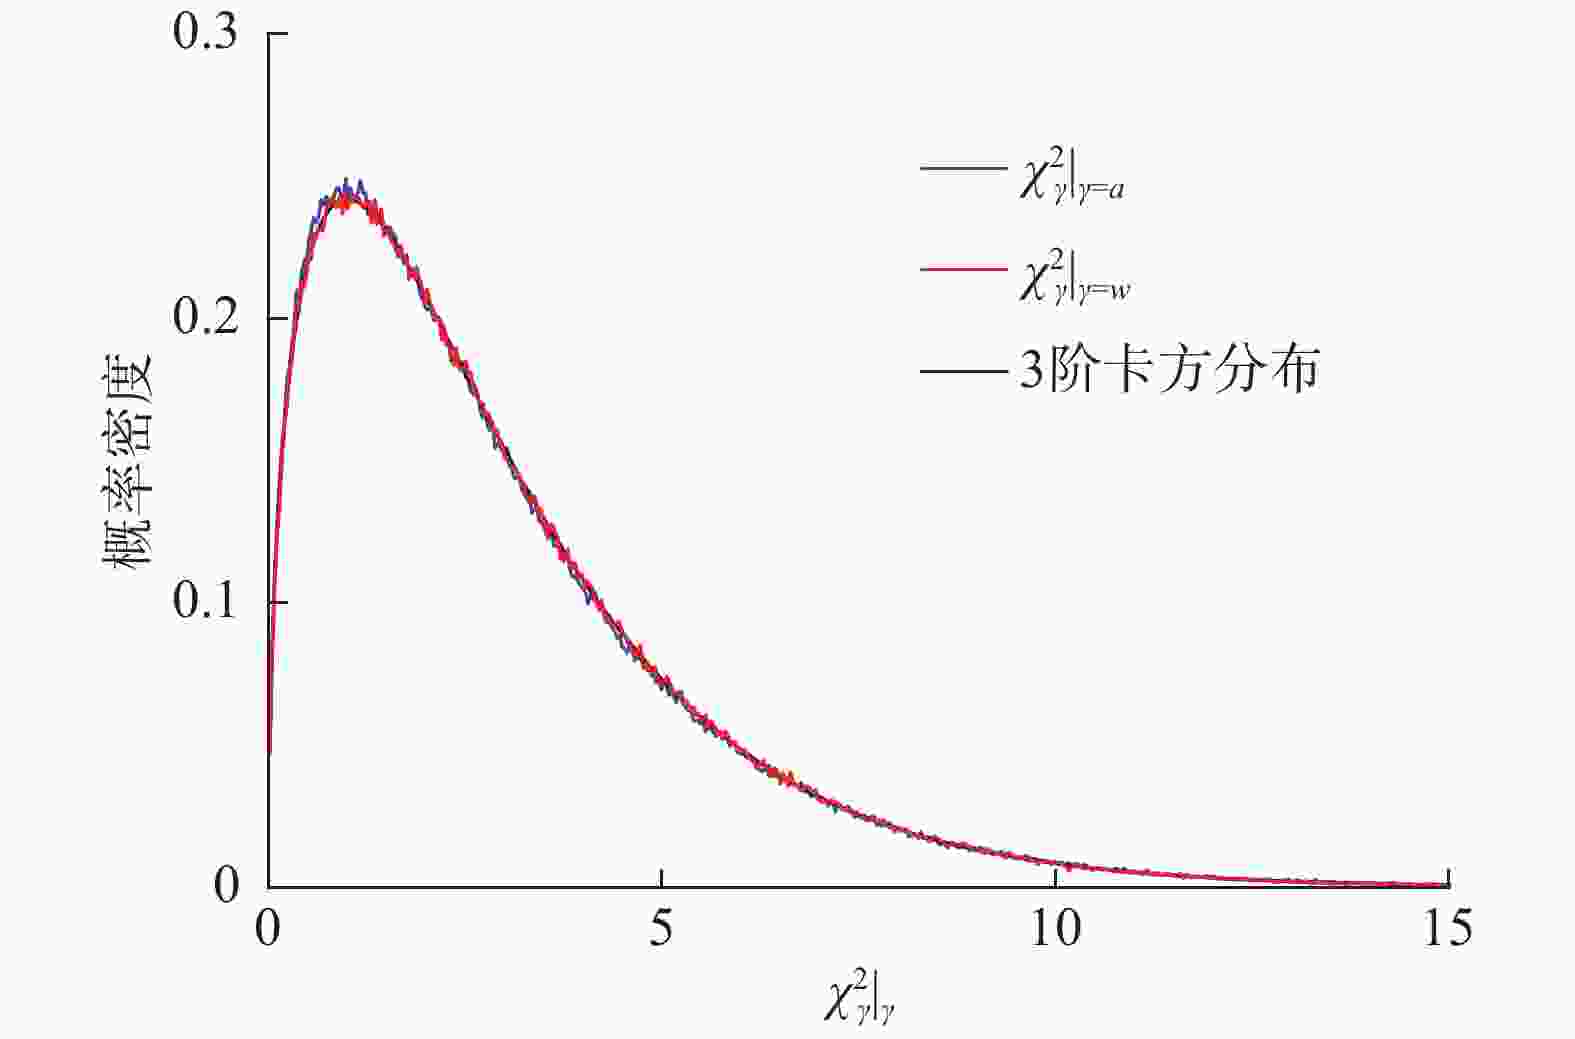
图 1
$ {{\chi}_{\gamma }^{2}|}_{{{\gamma }}={{w}}} $ 和$ {{\chi}_{\gamma }^{2}|}_{{{\gamma }}={{a}}} $ 的模拟概率密度Figure 1. Simulated density of
$ {{\chi}_{\gamma }^{2}|}_{{{\gamma }}={{w}}} $ and$ {{\chi}_{\gamma }^{2}|}_{{{\gamma }}={{a}}} $ 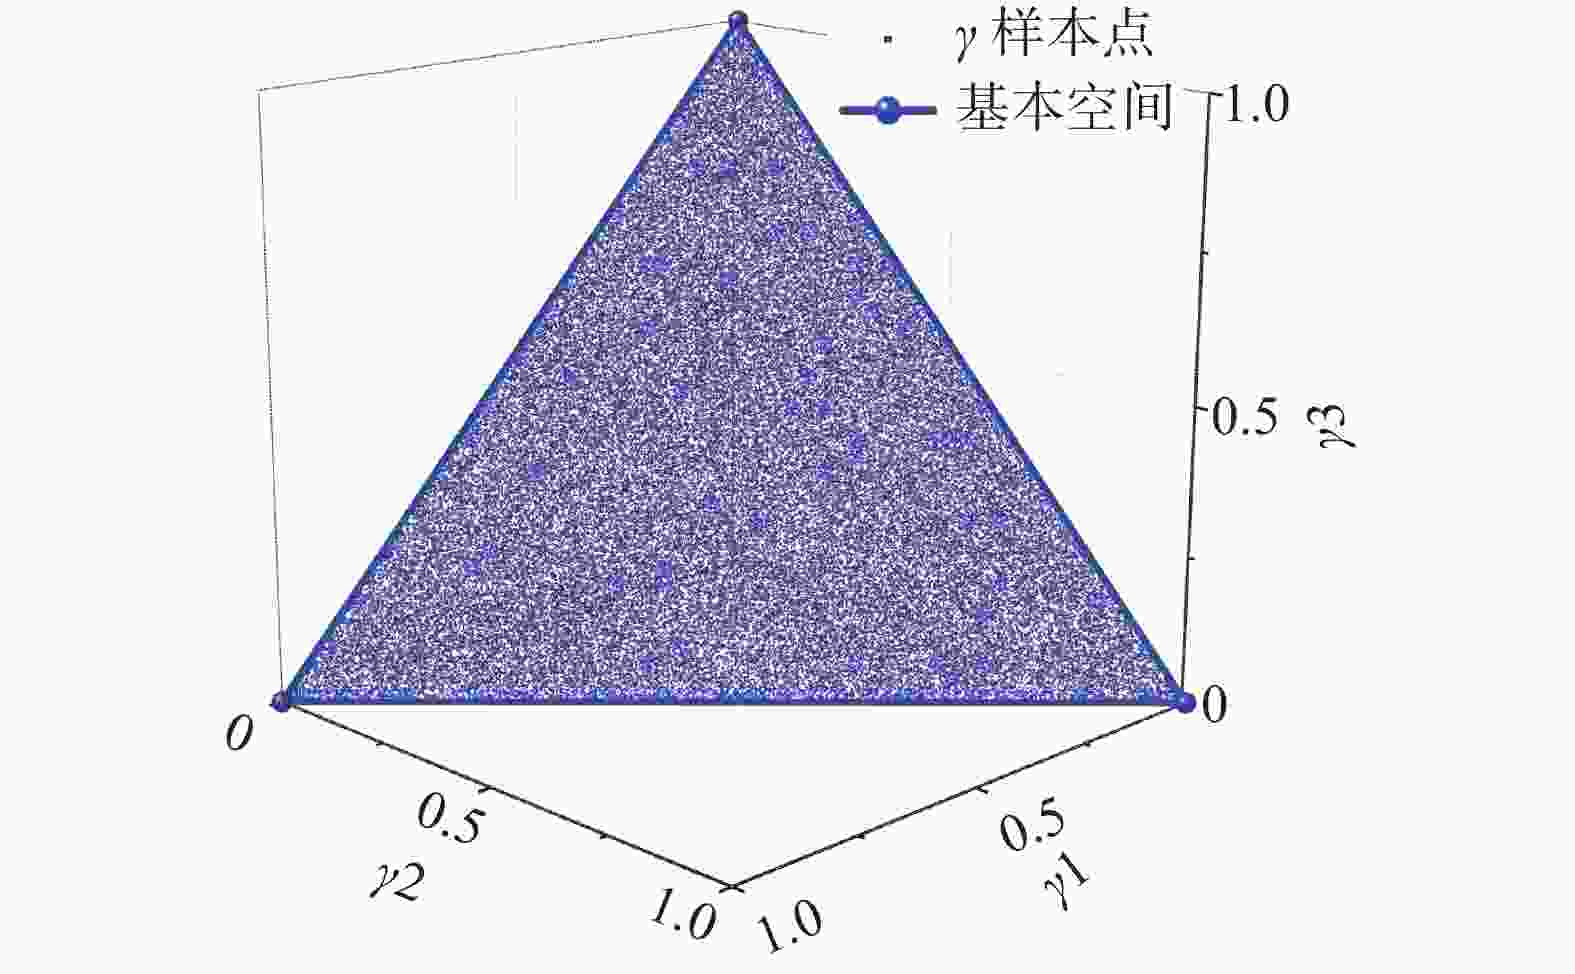
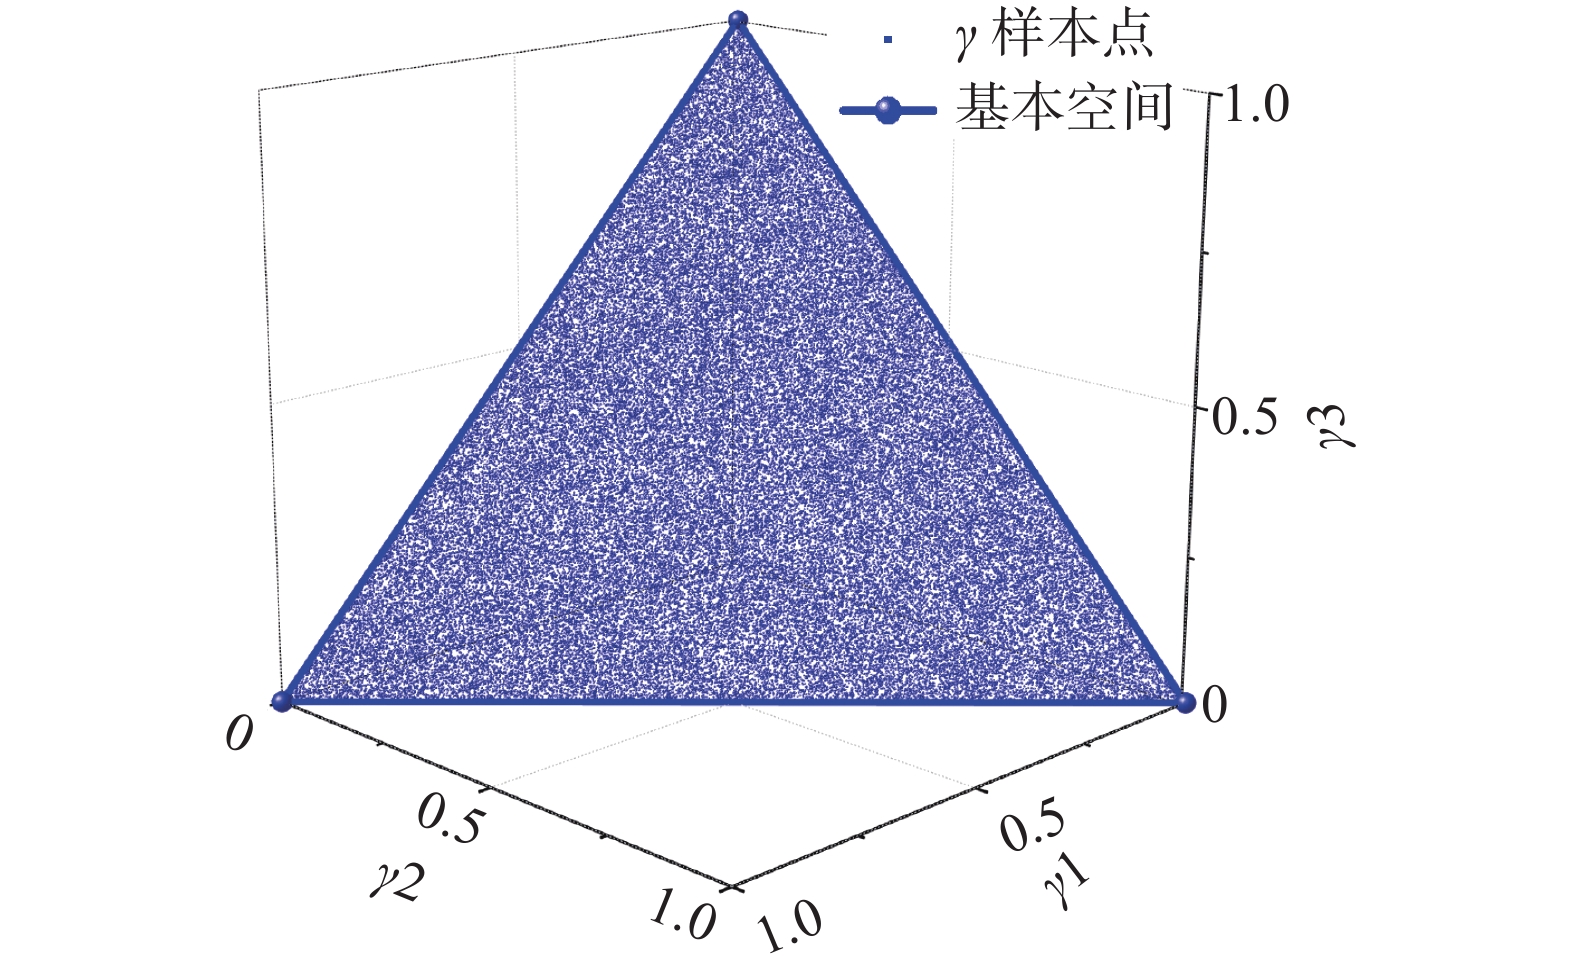
图 2 基本空间中的
$ {{\gamma }} $ 样本($ n=3 $ )Figure 2. Samples of
$ {{\gamma }} $ in basic space (n = 3)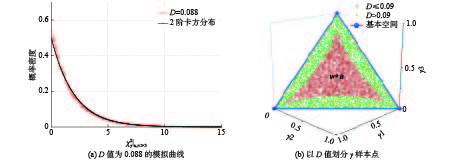
图 3
${{\chi}_{\gamma }^{2}|}_{u,n\geqslant 3}$ 服从或近似服从2阶卡方分布的$ {{\gamma }} $ 样本Figure 3. Samples of
$ {{\gamma }} $ contribute or approximately contribute${{\chi}_{\gamma }^{2}|}_{u,n\geqslant 3}$ to the 2nd order chi-square distribution
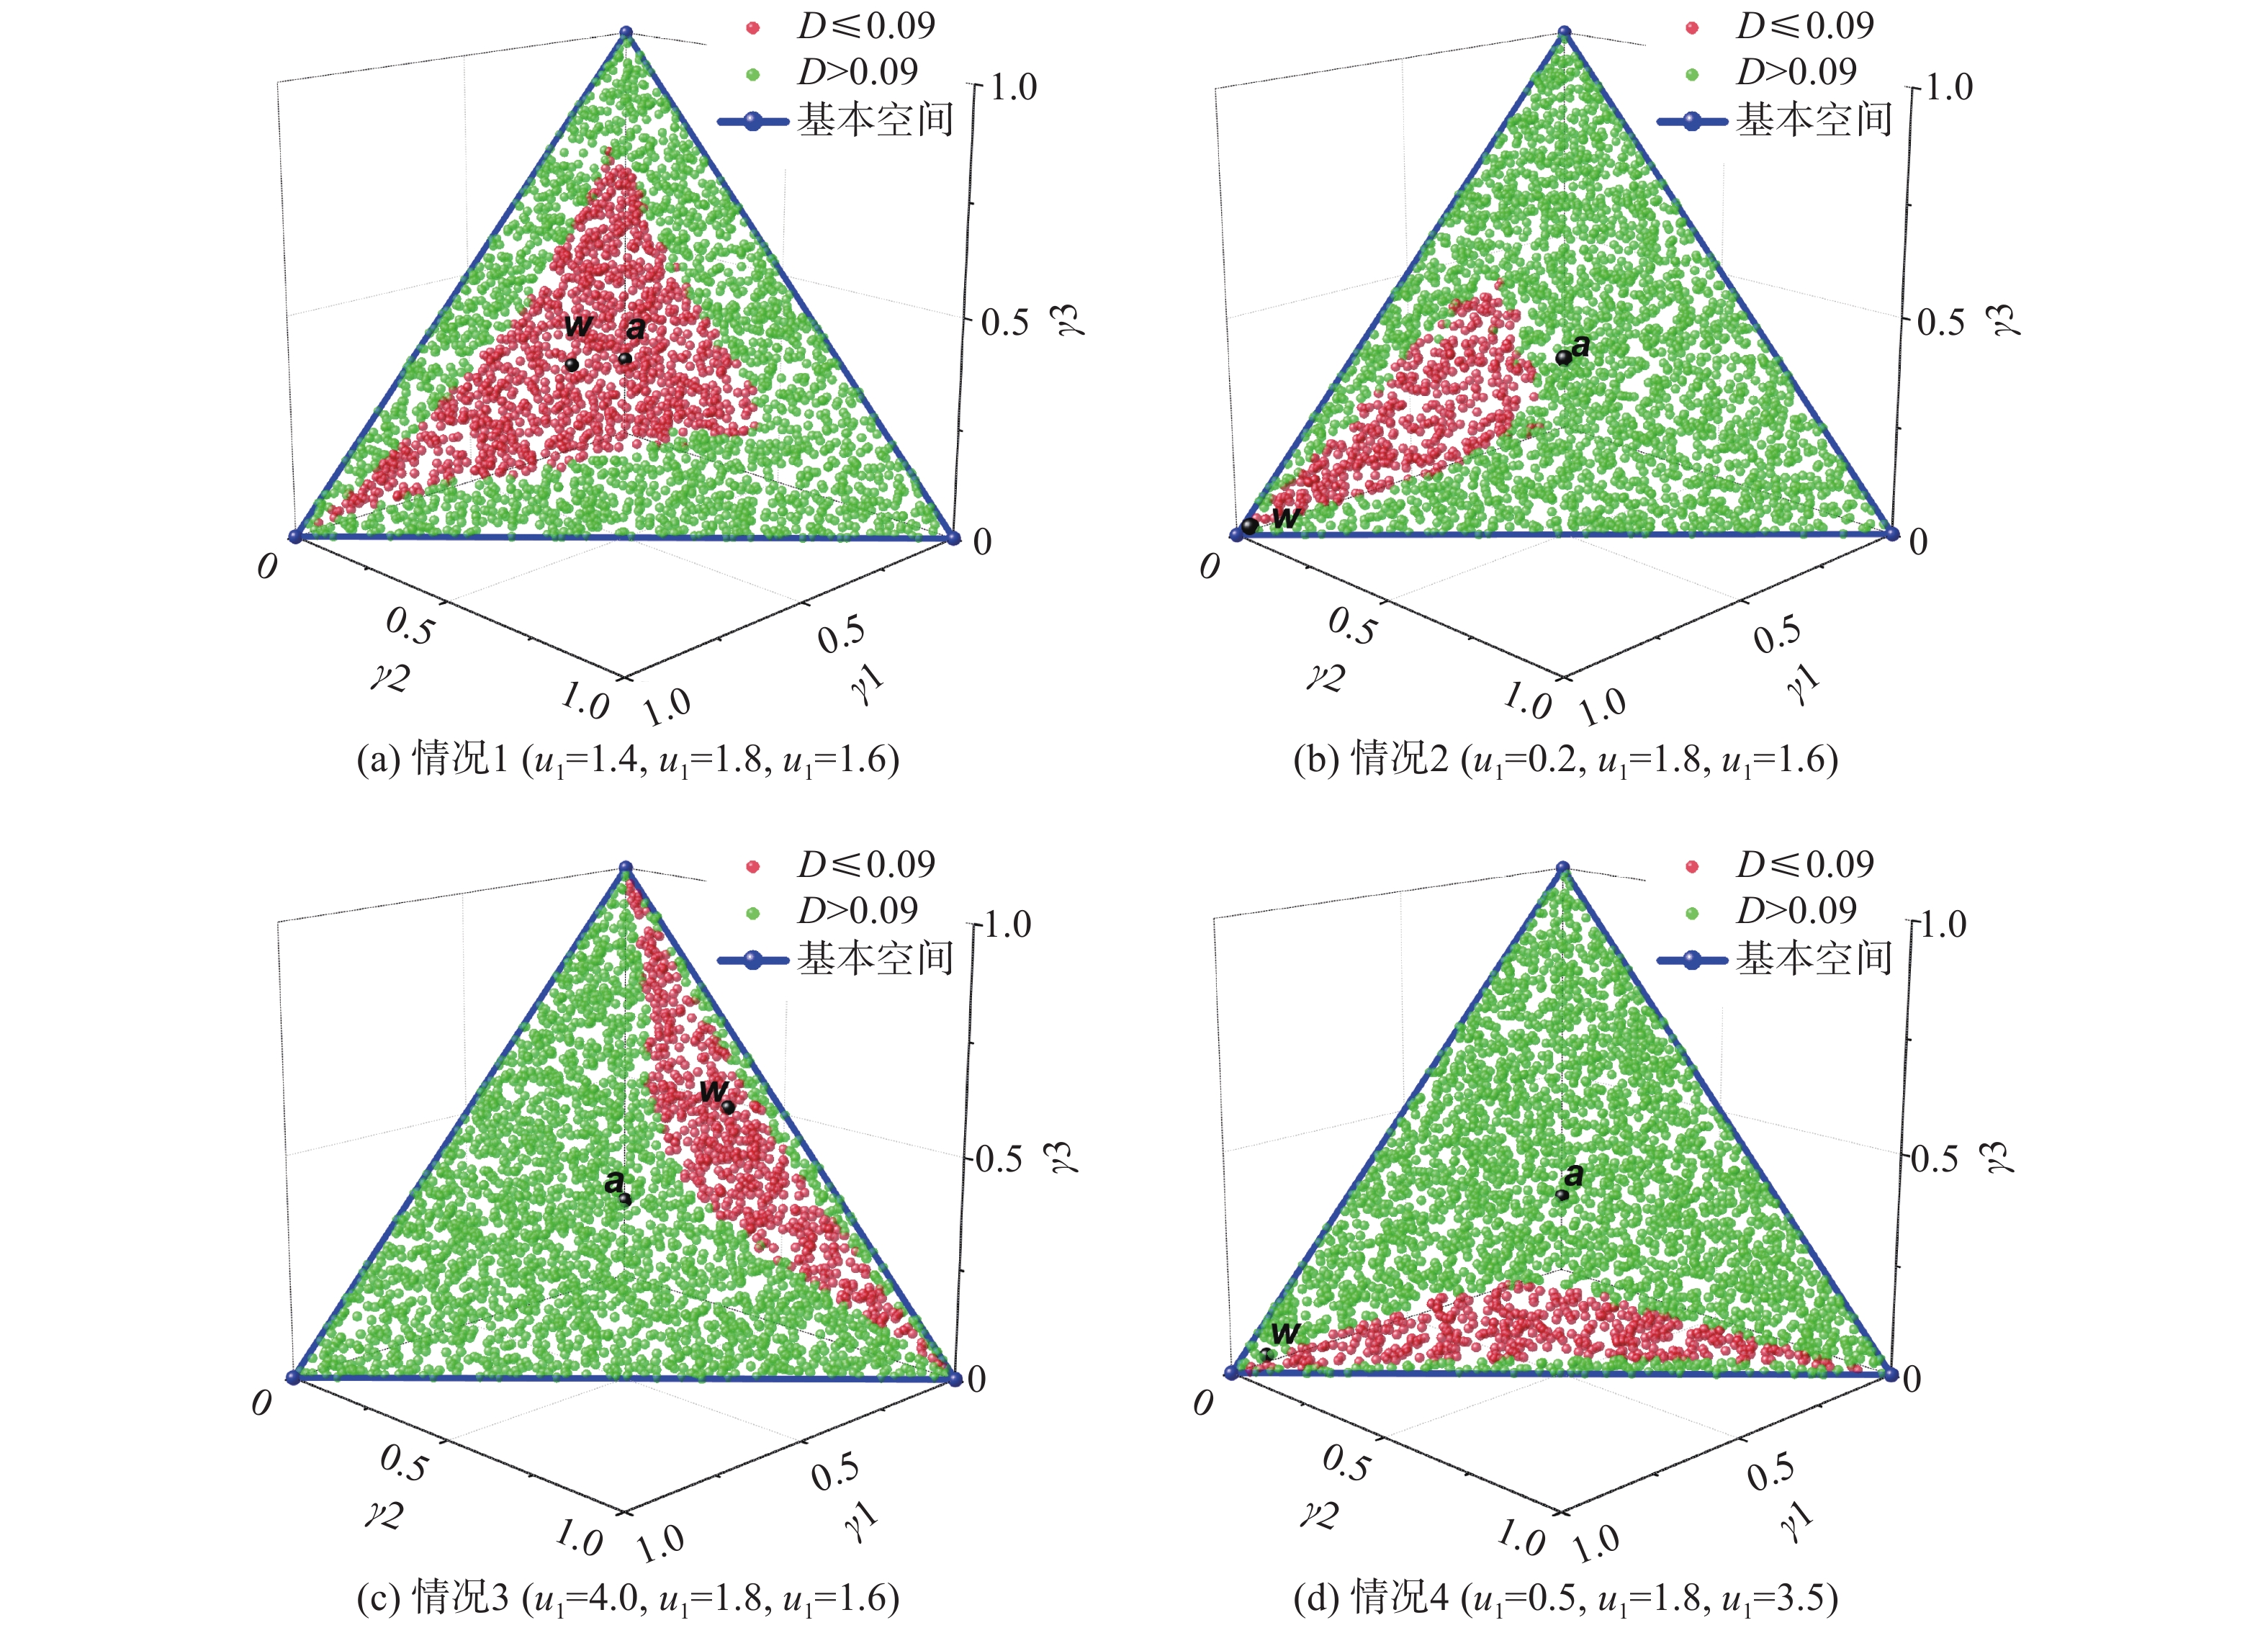
图 4
$ {\chi}_{\gamma }^{2} $ 服从或近似服从卡方分布的$ {{\gamma }} $ 样本Figure 4. Samples of
$ {{\gamma }} $ contribute$ {\chi}_{\gamma }^{2} $ to the chi-square distribution
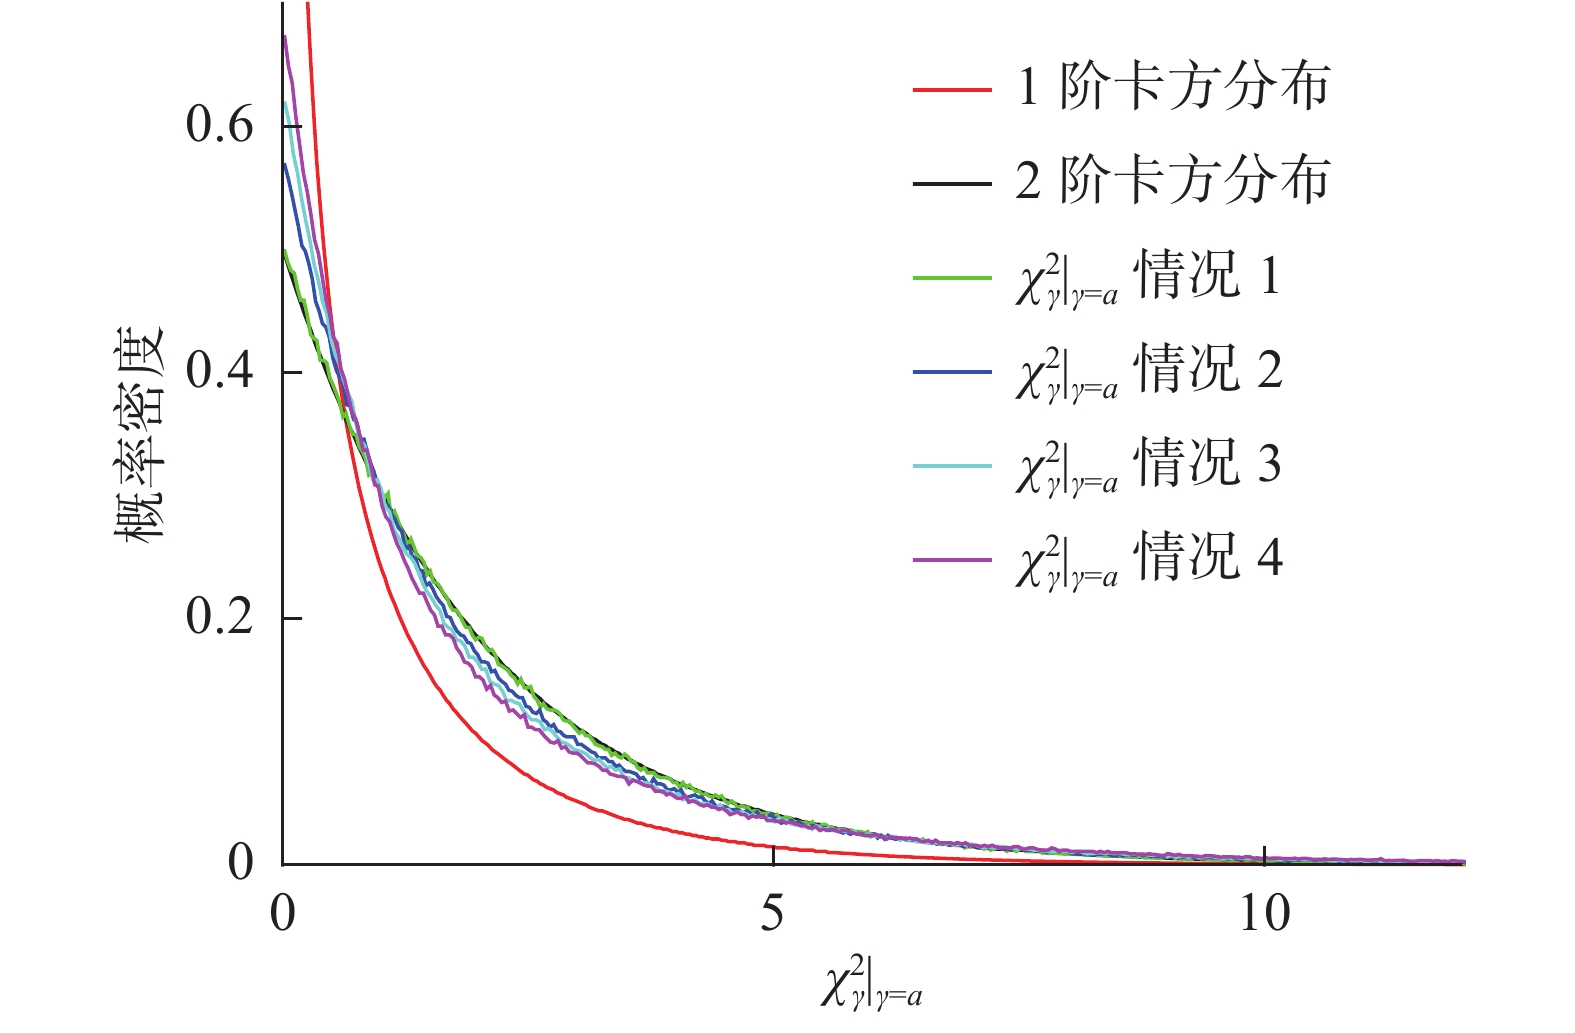
图 5 4种情况下
$ {{\chi}_{\gamma }^{2}|}_{{{\gamma }}={{a}}} $ 的模拟概率密度曲线Figure 5. Simulated density curves of
$ {{\chi}_{\gamma }^{2}|}_{{{\gamma }}={{a}}} $ under the 4 uncertainties conditions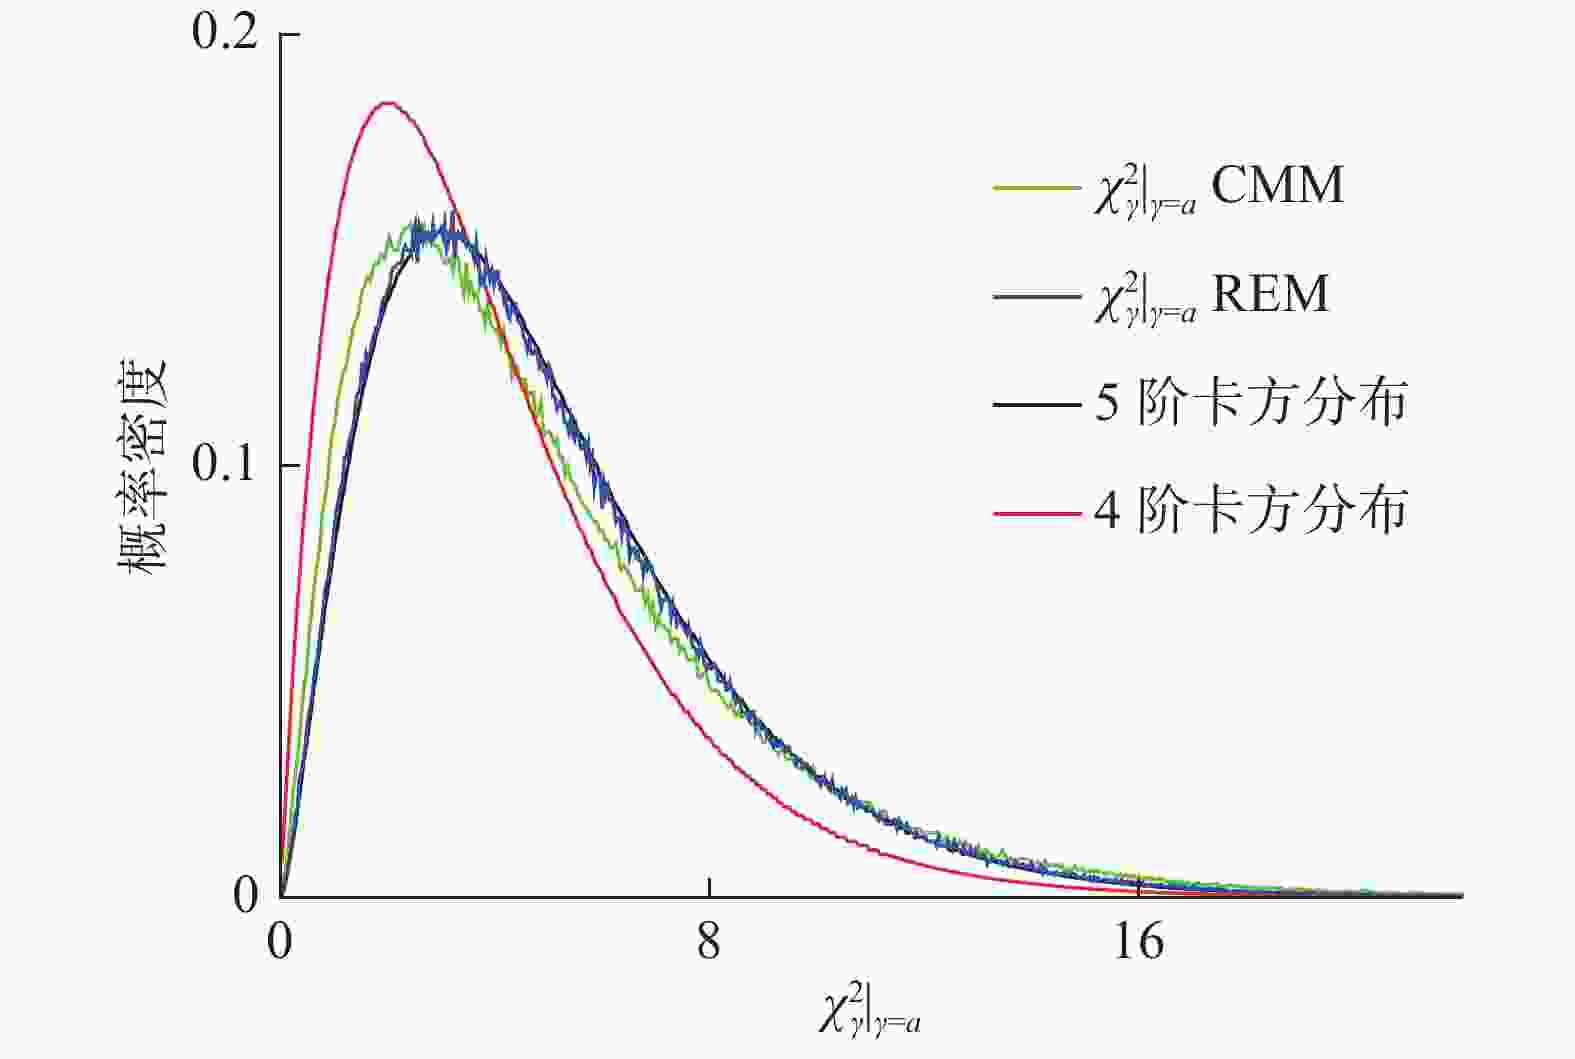
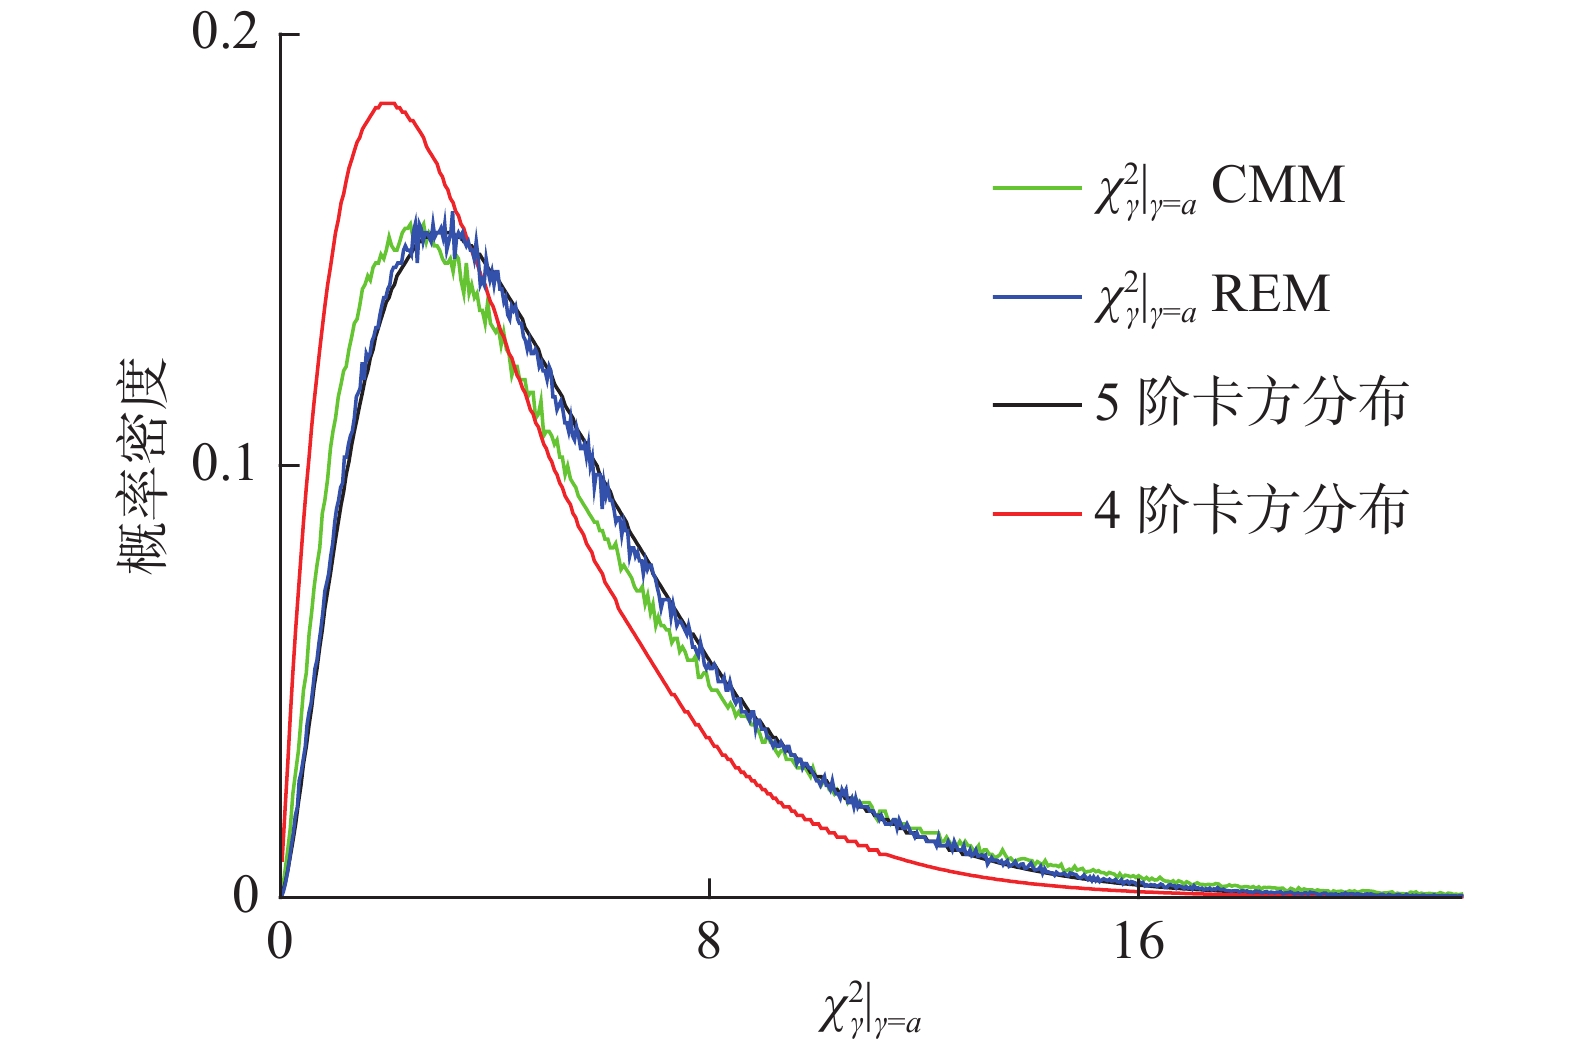
图 6
$ {{\chi}_{\gamma }^{2}|}_{{{\gamma }}={{a}}} $ 的模拟概率密度曲线(CMM和REM)Figure 6. Simulated density curves of
$ {{\chi}_{\gamma }^{2}|}_{{{\gamma }}={{a}}} $ (CMM and REM)表 1
$ {u}_{i} $ 的4种情况($ n=3 $ )Table 1. Four conditions of
$ {u}_{i} $ (n = 3)序号 模拟条件 $ {u}_{1} $ $ {u}_{2} $ $ {u}_{3} $ 序号 模拟条件 $ {u}_{1} $ $ {u}_{2} $ $ {u}_{3} $ 1 $ {u}_{i} $数值大致相当 1.4 1.8 1.6 3 一个$ {u}_{i} $数值很大 4.0 1.8 1.6 2 一个$ {u}_{i} $数值很小 0.2 1.8 1.6 4 $ {u}_{i} $数值差异较大 0.5 1.8 3.5  下载: 导出CSV
表 2 比对结果和不确定度(正态分布且
$ n=4 $ )Table 2. Comparison results and uncertainties (Gaussian distribution and n = 4)
结果 实验室1 实验室2 实验室3 实验室4 $ {x}_{i} $ 9.5 13.9 7.2 11.6 $ {u}_{i} $ 1.4 2.0 1.6 1.8
下载: 导出CSV
表 3 比对结果和不确定度(正态分布且
$ n=6 $ )Table 3. Comparison results and uncertainties (Gaussian distribution and n = 6)
结果 实验室1 实验室2 实验室3 实验室4 实验室5 实验室6 $ {x}_{i} $ 9.5 13.9 7.2 11.6 13.5 8.7 $ {u}_{i} $ 1.4 2.0 1.6 1.8 0.1 2.5
下载: 导出CSV
-
[1] 原遵东, 王池, 林延东. 确定量值比对参考值的准则[J]. 仪器仪表学报, 2010, 31(10): 2381-2385. [2] 张海云, 吴忠杰, 杭晨哲, 等. MCMC法确定关键比对参考值及其不确定度[J]. 计量技术, 2020(7): 3-7, 26. doi: 10.3969/j.issn.1000-0771.2020.07.01 [3] Cox M G. The evaluation of key comparison data[J]. Metrologia, 2002, 39(6): 589-595. doi: 10.1088/0026-1394/39/6/10 [4] Koepke A, Lafarge T, Possolo A, et al. Consensus building for interlaboratory studies, key comparisons, and meta-analysis[J]. Metrologia, 2017, 54(3): S34-S62. doi: 10.1088/1681-7575/aa6c0e [5] Toman B, Possolo A. Laboratory effects models for interlaboratory comparisons[J]. Accred Qual Assur, 2009, 14(10): 553-563. doi: 10.1007/s00769-009-0547-2 [6] Elster C, Toman B. Analysis of key comparisons: estimating laboratories’ biases by a fixed effects model using Bayesian model averaging[J]. Metrologia, 2010, 47(3): 113-119. doi: 10.1088/0026-1394/47/3/001 [7] Steele A G, Douglas R J. Extending chi-squared statistics for key comparisons in metrology[J]. Journal of Computational and Applied Mathematics, 2006(192): 51-58. [8] Rukhin A L. Weighted means statistics in interlaboratory studies[J]. Metrologia, 2017, 46(3): 323-331. [9] Toman B, Fischer J, Elster C. Alternative analyses of measurements of the Planck constant[J]. Metrologia, 2012, 49(4): 567-571. doi: 10.1088/0026-1394/49/4/567 [10] Paule R C, Mandel J. Consensus values and weighting factors[J]. J. Res. Natl Bureau Stand, 1982, 87(5): 377-385. doi: 10.6028/jres.087.022 [11] Graybill F A, Deal R B. Combining unbiased estimators[J]. Biometrics, 1959(15): 543-550. [12] BIPM. CCQM guidance note: estimation of a consensus KCRV and associated degrees of equivalence[DB/OL]. http://www.bipm.org/cc/CCQM/Allowed/19/CCQM13-22_Consensus_KCRV_v10.pdf, 2013: 23-25. -


 点击查看大图

计量
- 文章访问数: 679
- HTML全文浏览量: 261
- PDF下载量: 100
- 被引次数: 0

